LifeLab - Education Technology Learning Management System (EdTech LMS)
Softening Data Visualization to Align with an Approachable Brand
My Role: UI Designer, Design System Designer, Researcher
Timeline: 2 weeks
Tools: Figma
Appealing to Modern Users with a Glass Aesthetic and Creative Ways to Display Data
The brand wanted to stand out against competitors, and not feel like a regular dashboard. Interviews and surveys showed that the users were not the “data-crunching” type.
Through market research, I identified digestible data for the target audience and created a design system that went in hand-in-hand.
Reviewing the Existing Design, the Problem, the User & the Facts
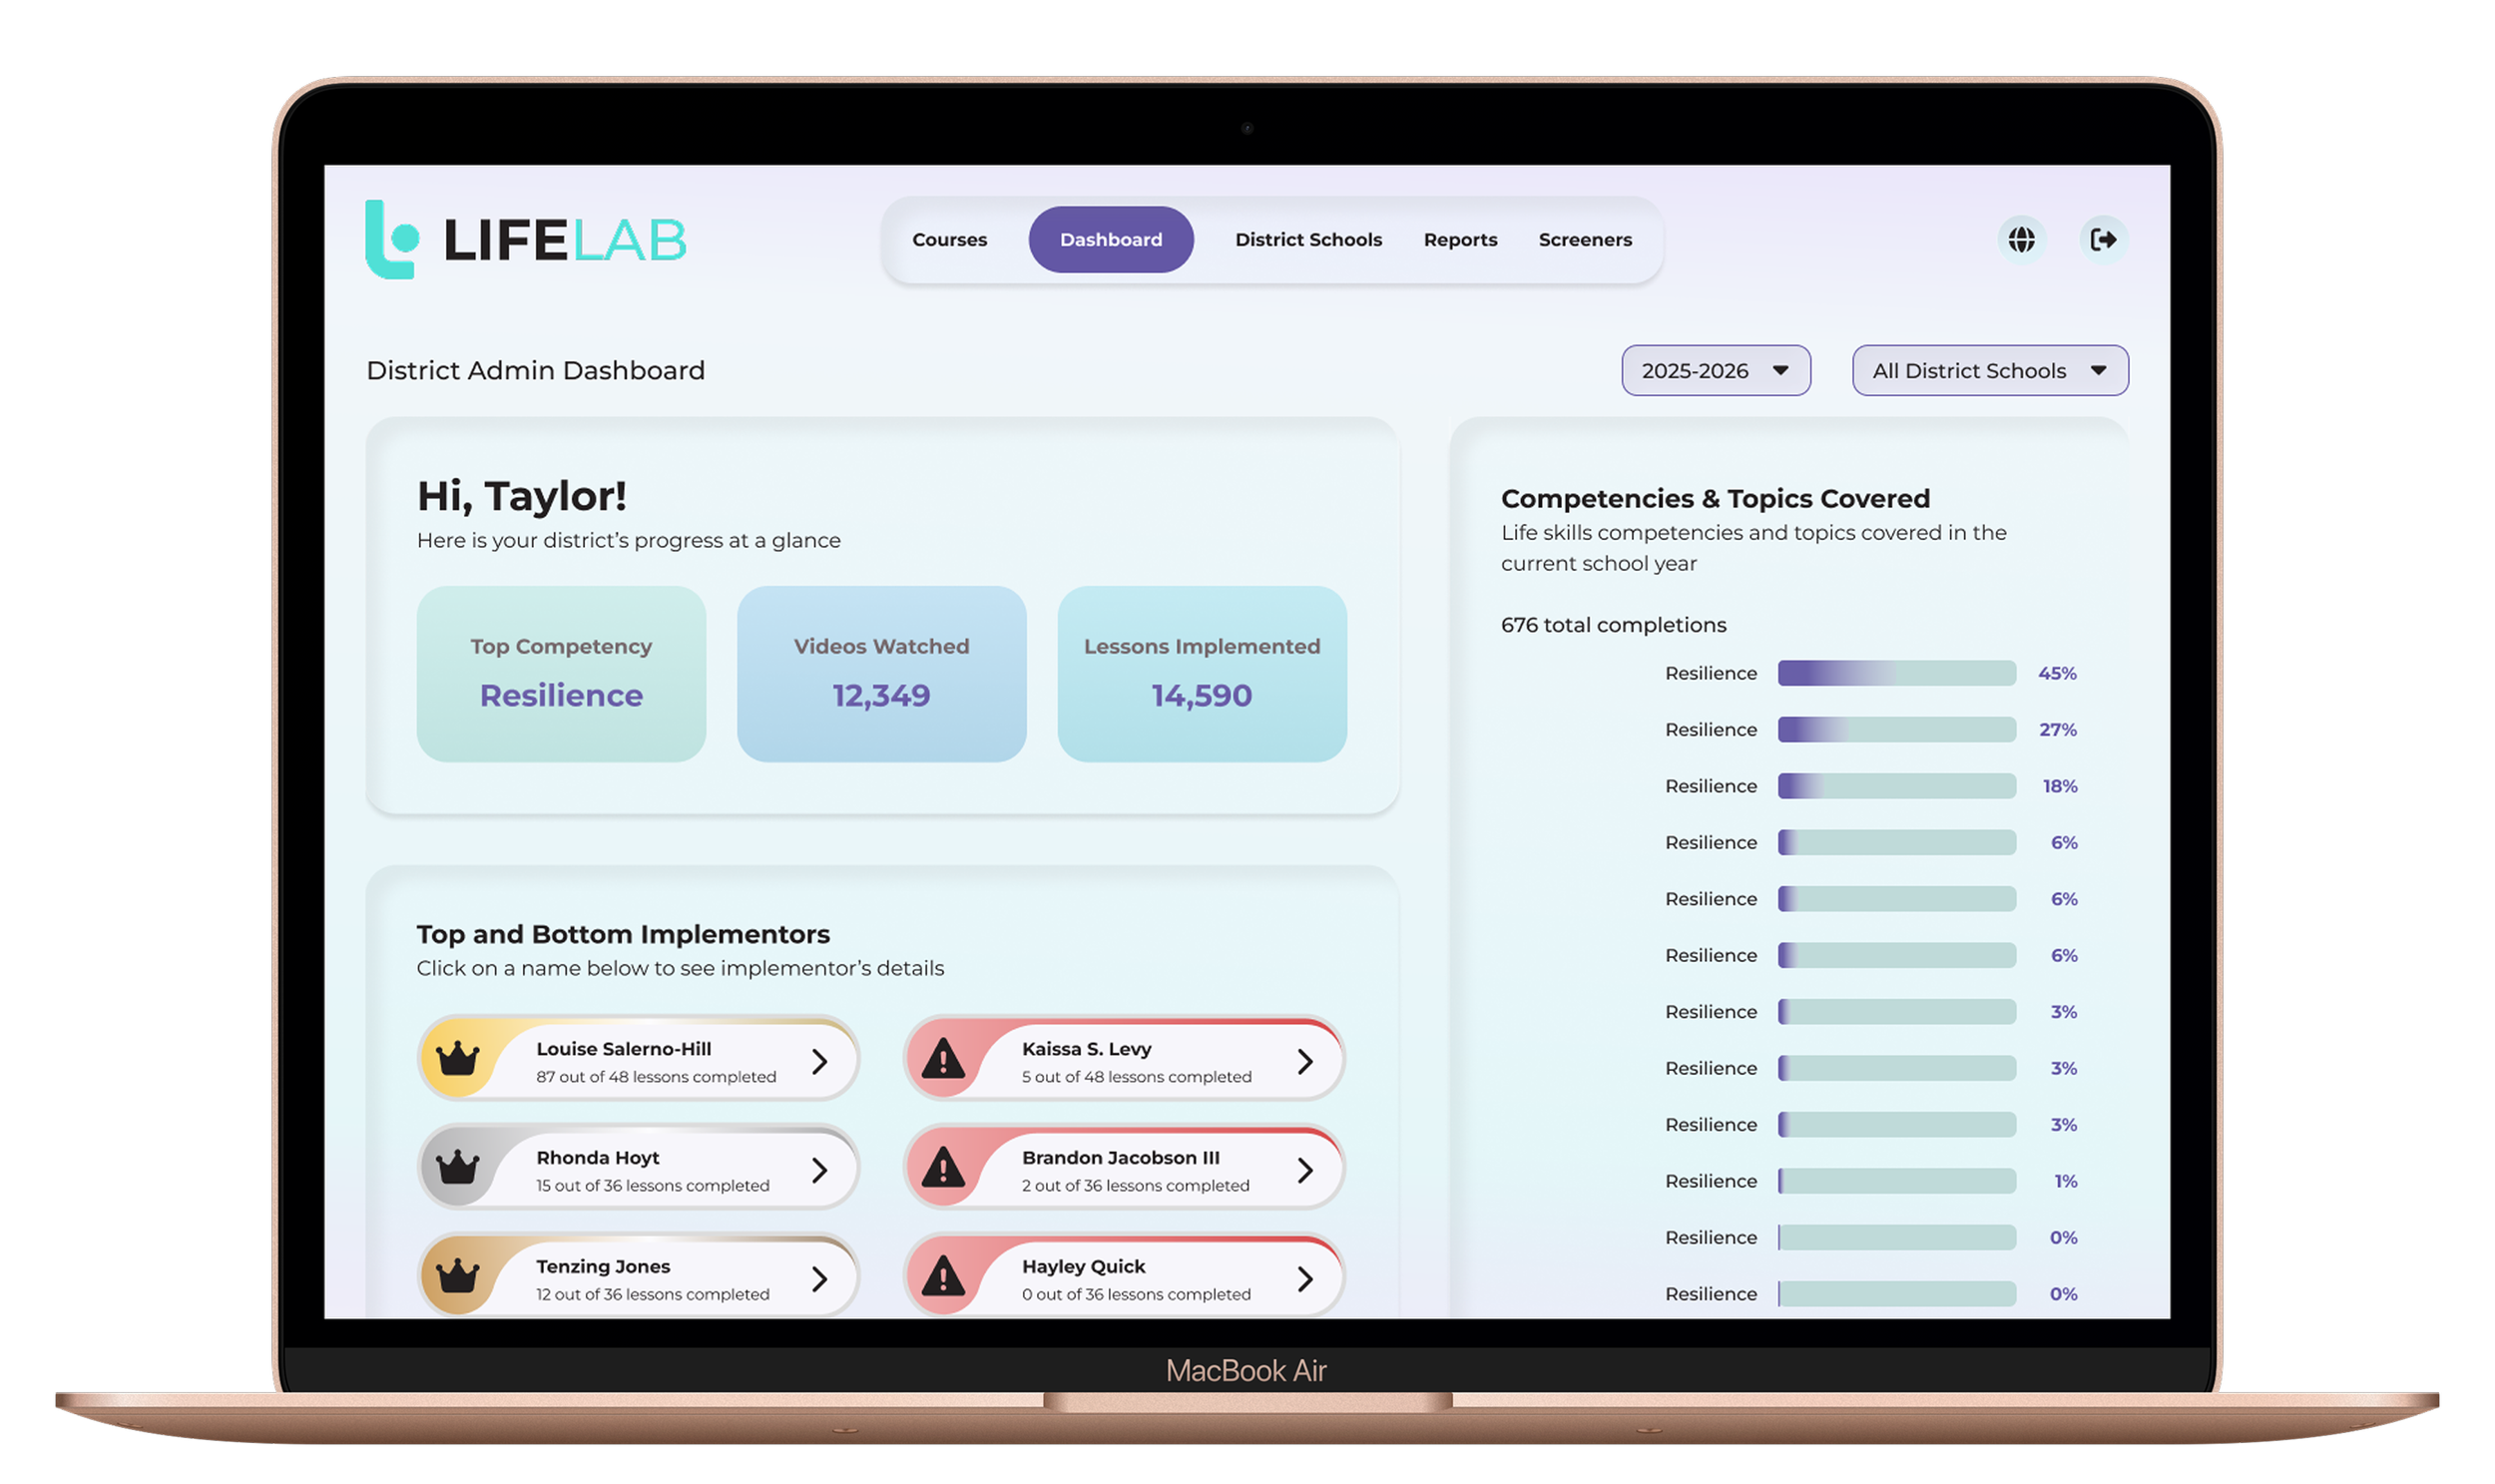
Before my redesign, the LMS sported a run-of-the-mill style. It featured detailed percentages that were hard to understand at a glance.
Demographics showed that mostly millennial women with Humanities and Arts Degrees were using this product. These weren’t mathematic fanatics or business majors that wanted nitty gritty decimals. They wanted breakdowns that summarized at a high-level.
Presenting Solutions & Results
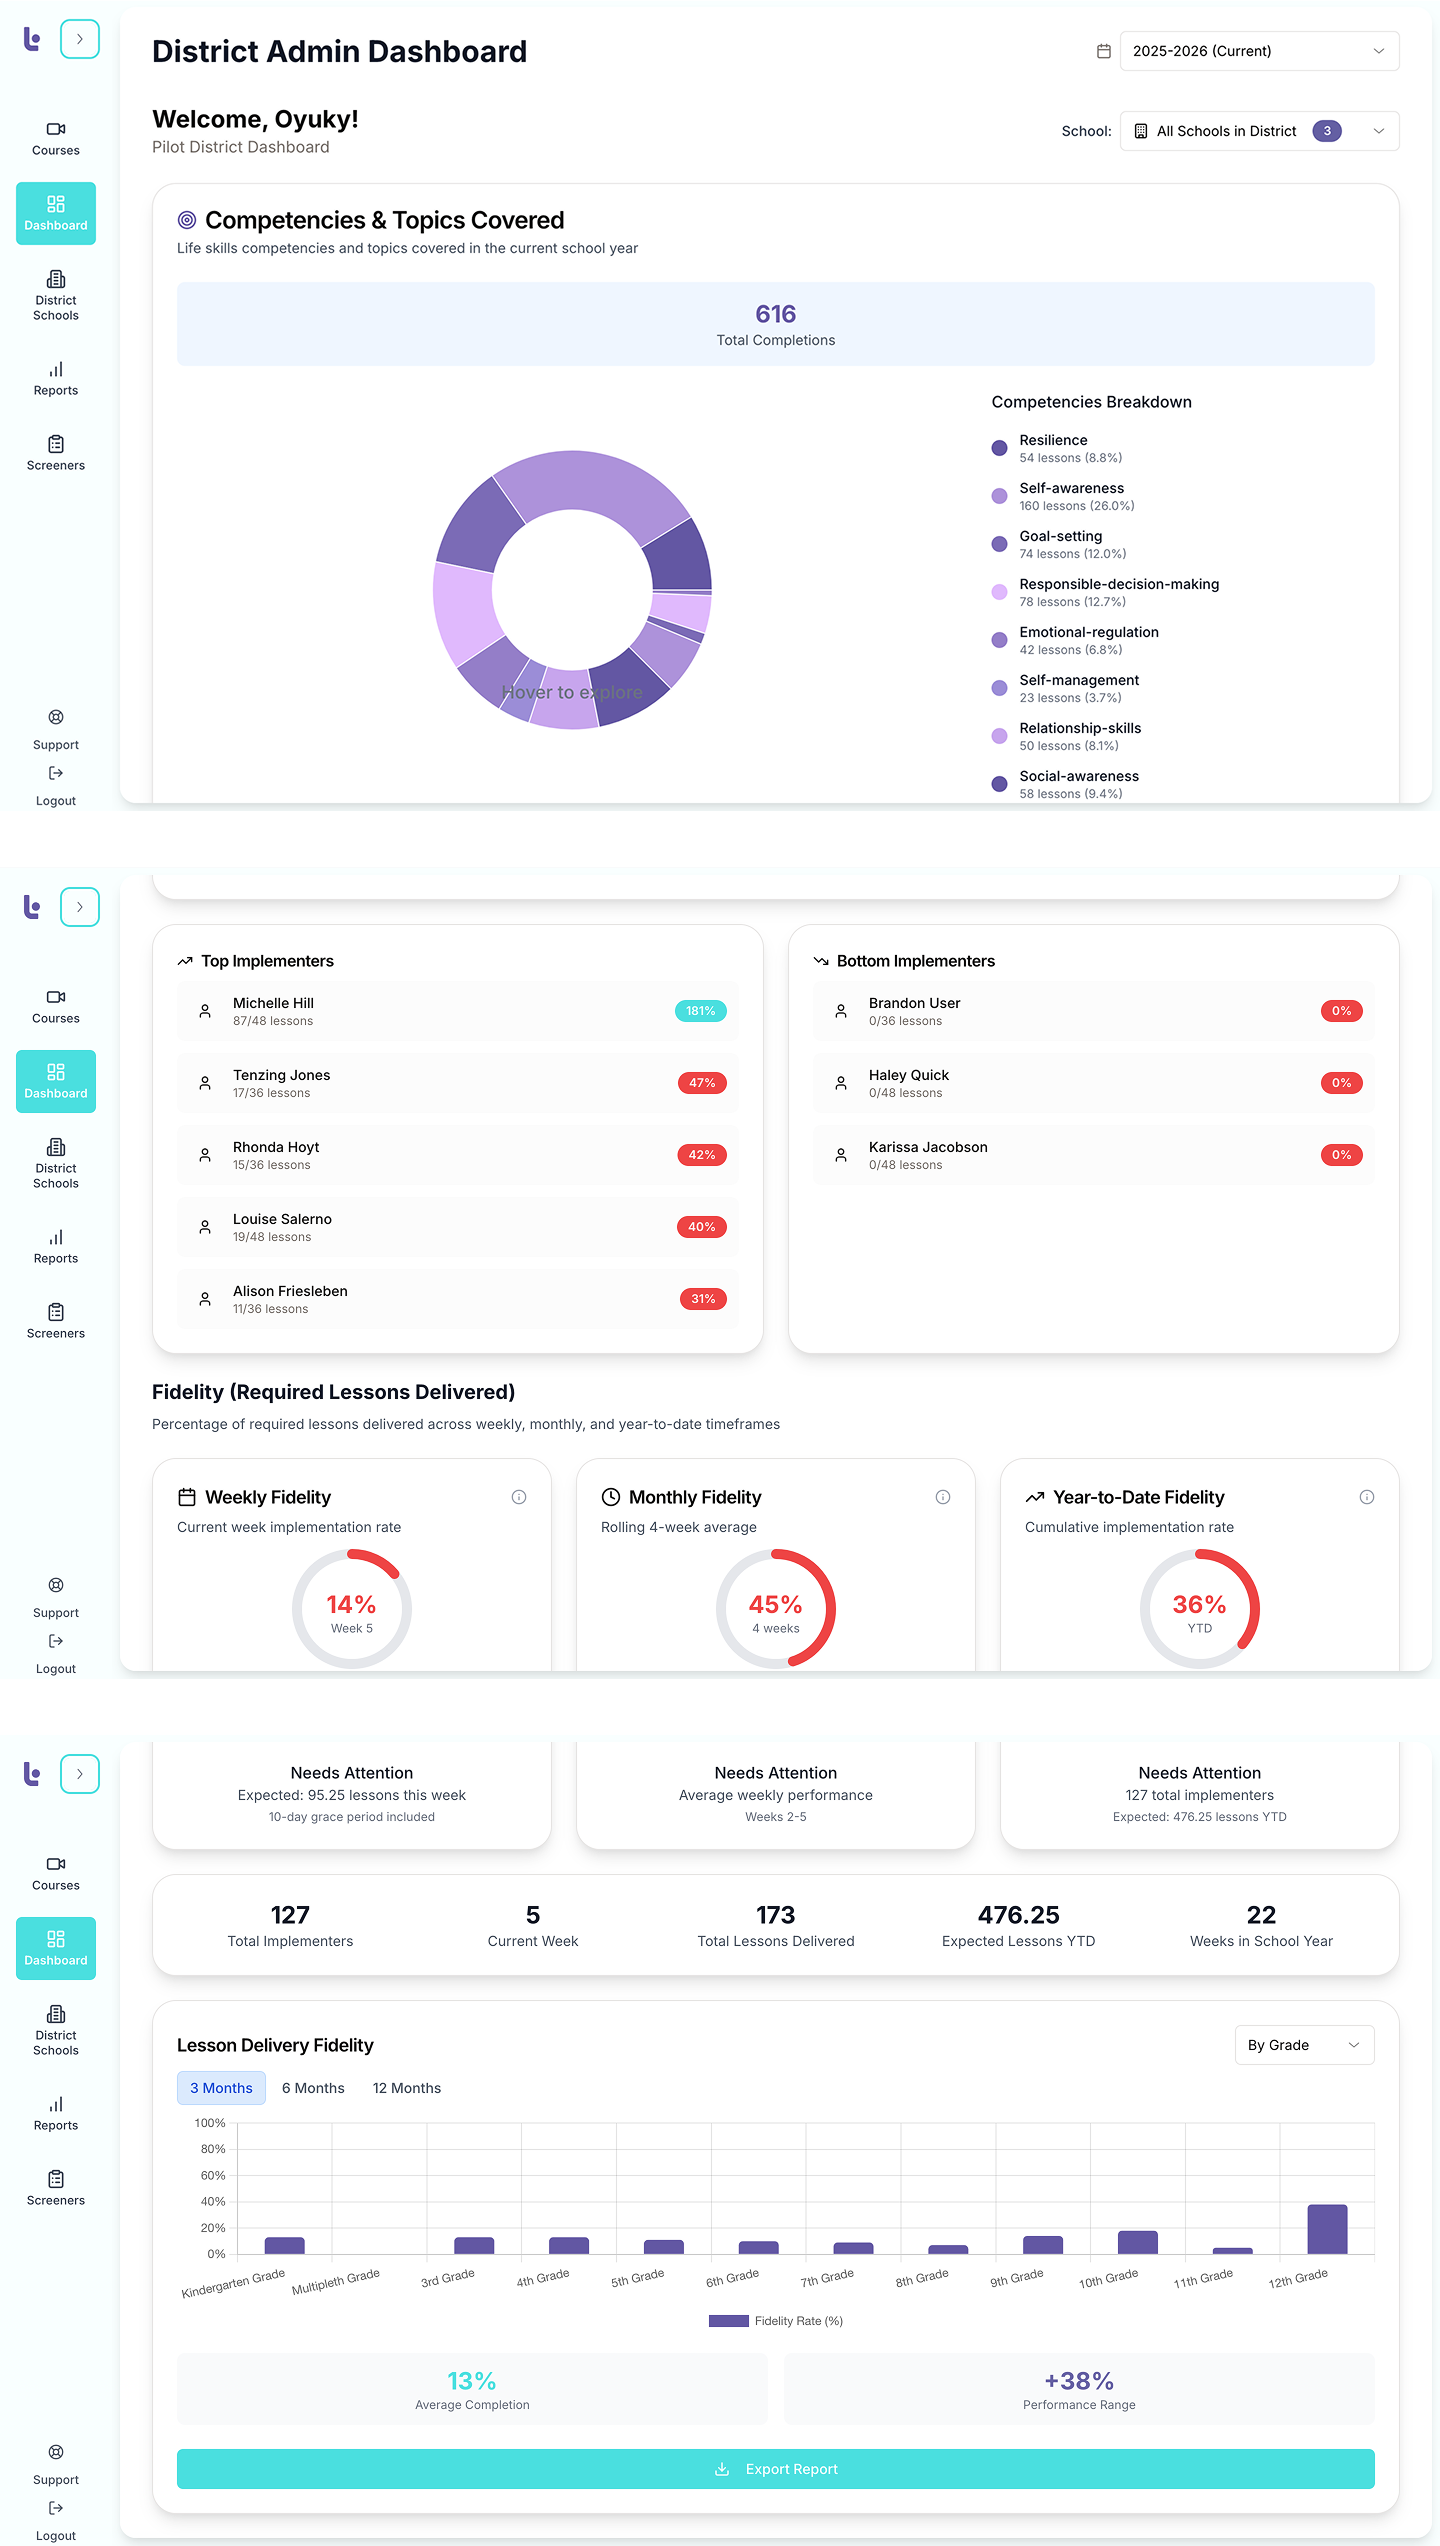
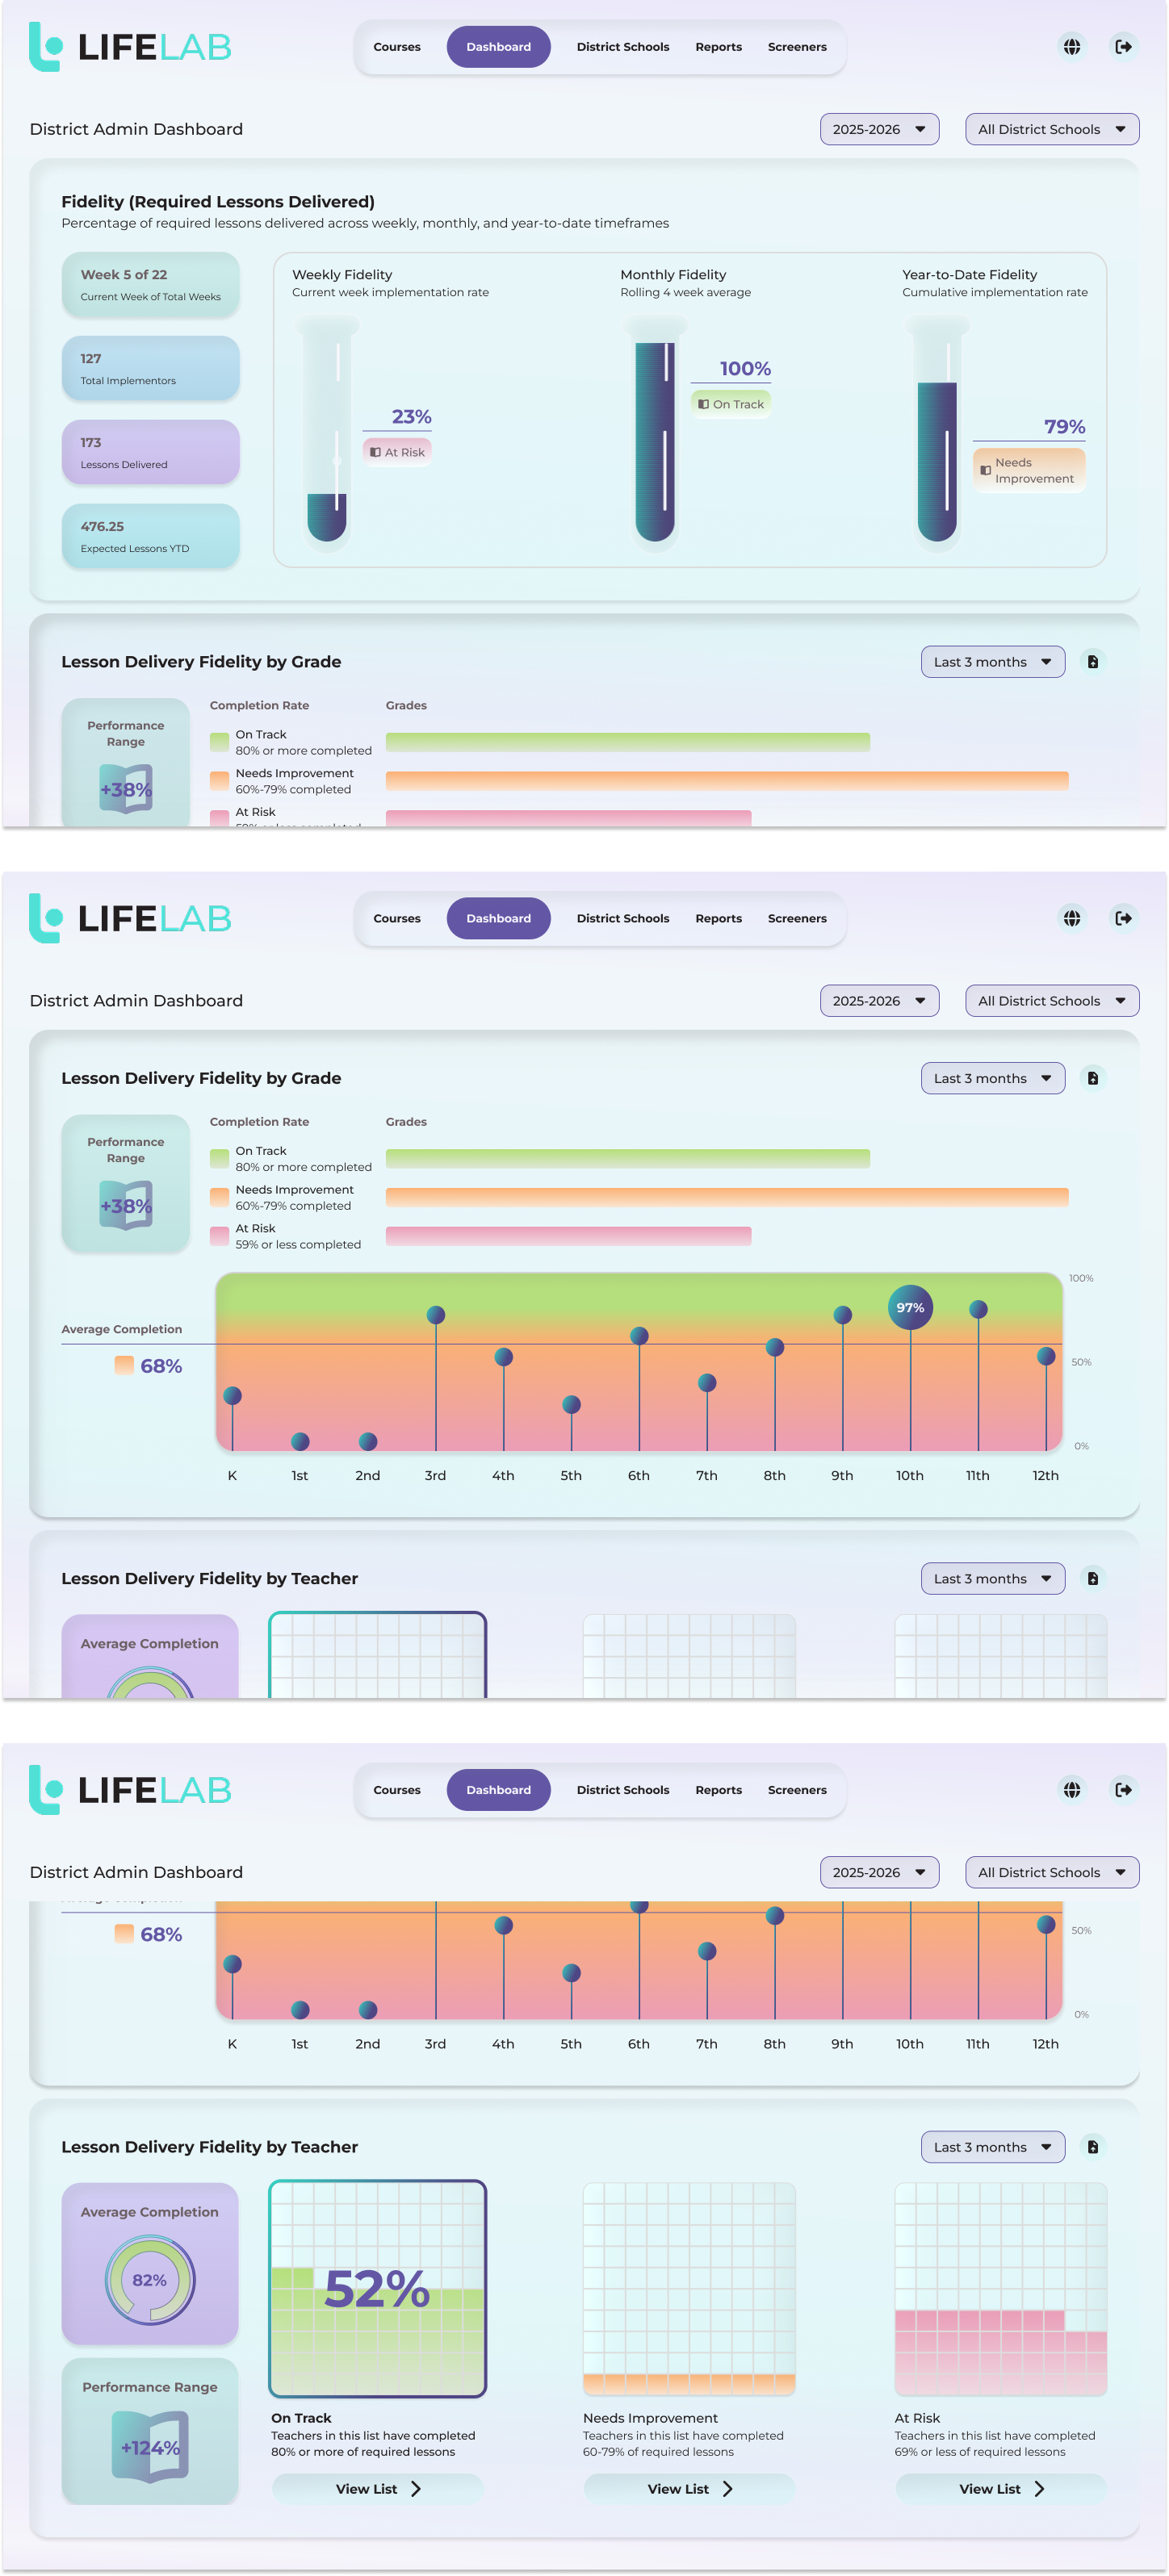
Considering the user’s preferences, I opted for clarity at a glance through graphs that were easier to scan.
This meant horizontal bar graphs listed in descending order, so that the eye would not be jumping around. It also meant reducing cognitive load by only displaying the most important facts and figures.
These solutions were all ran by users in A/B tests and interviews.
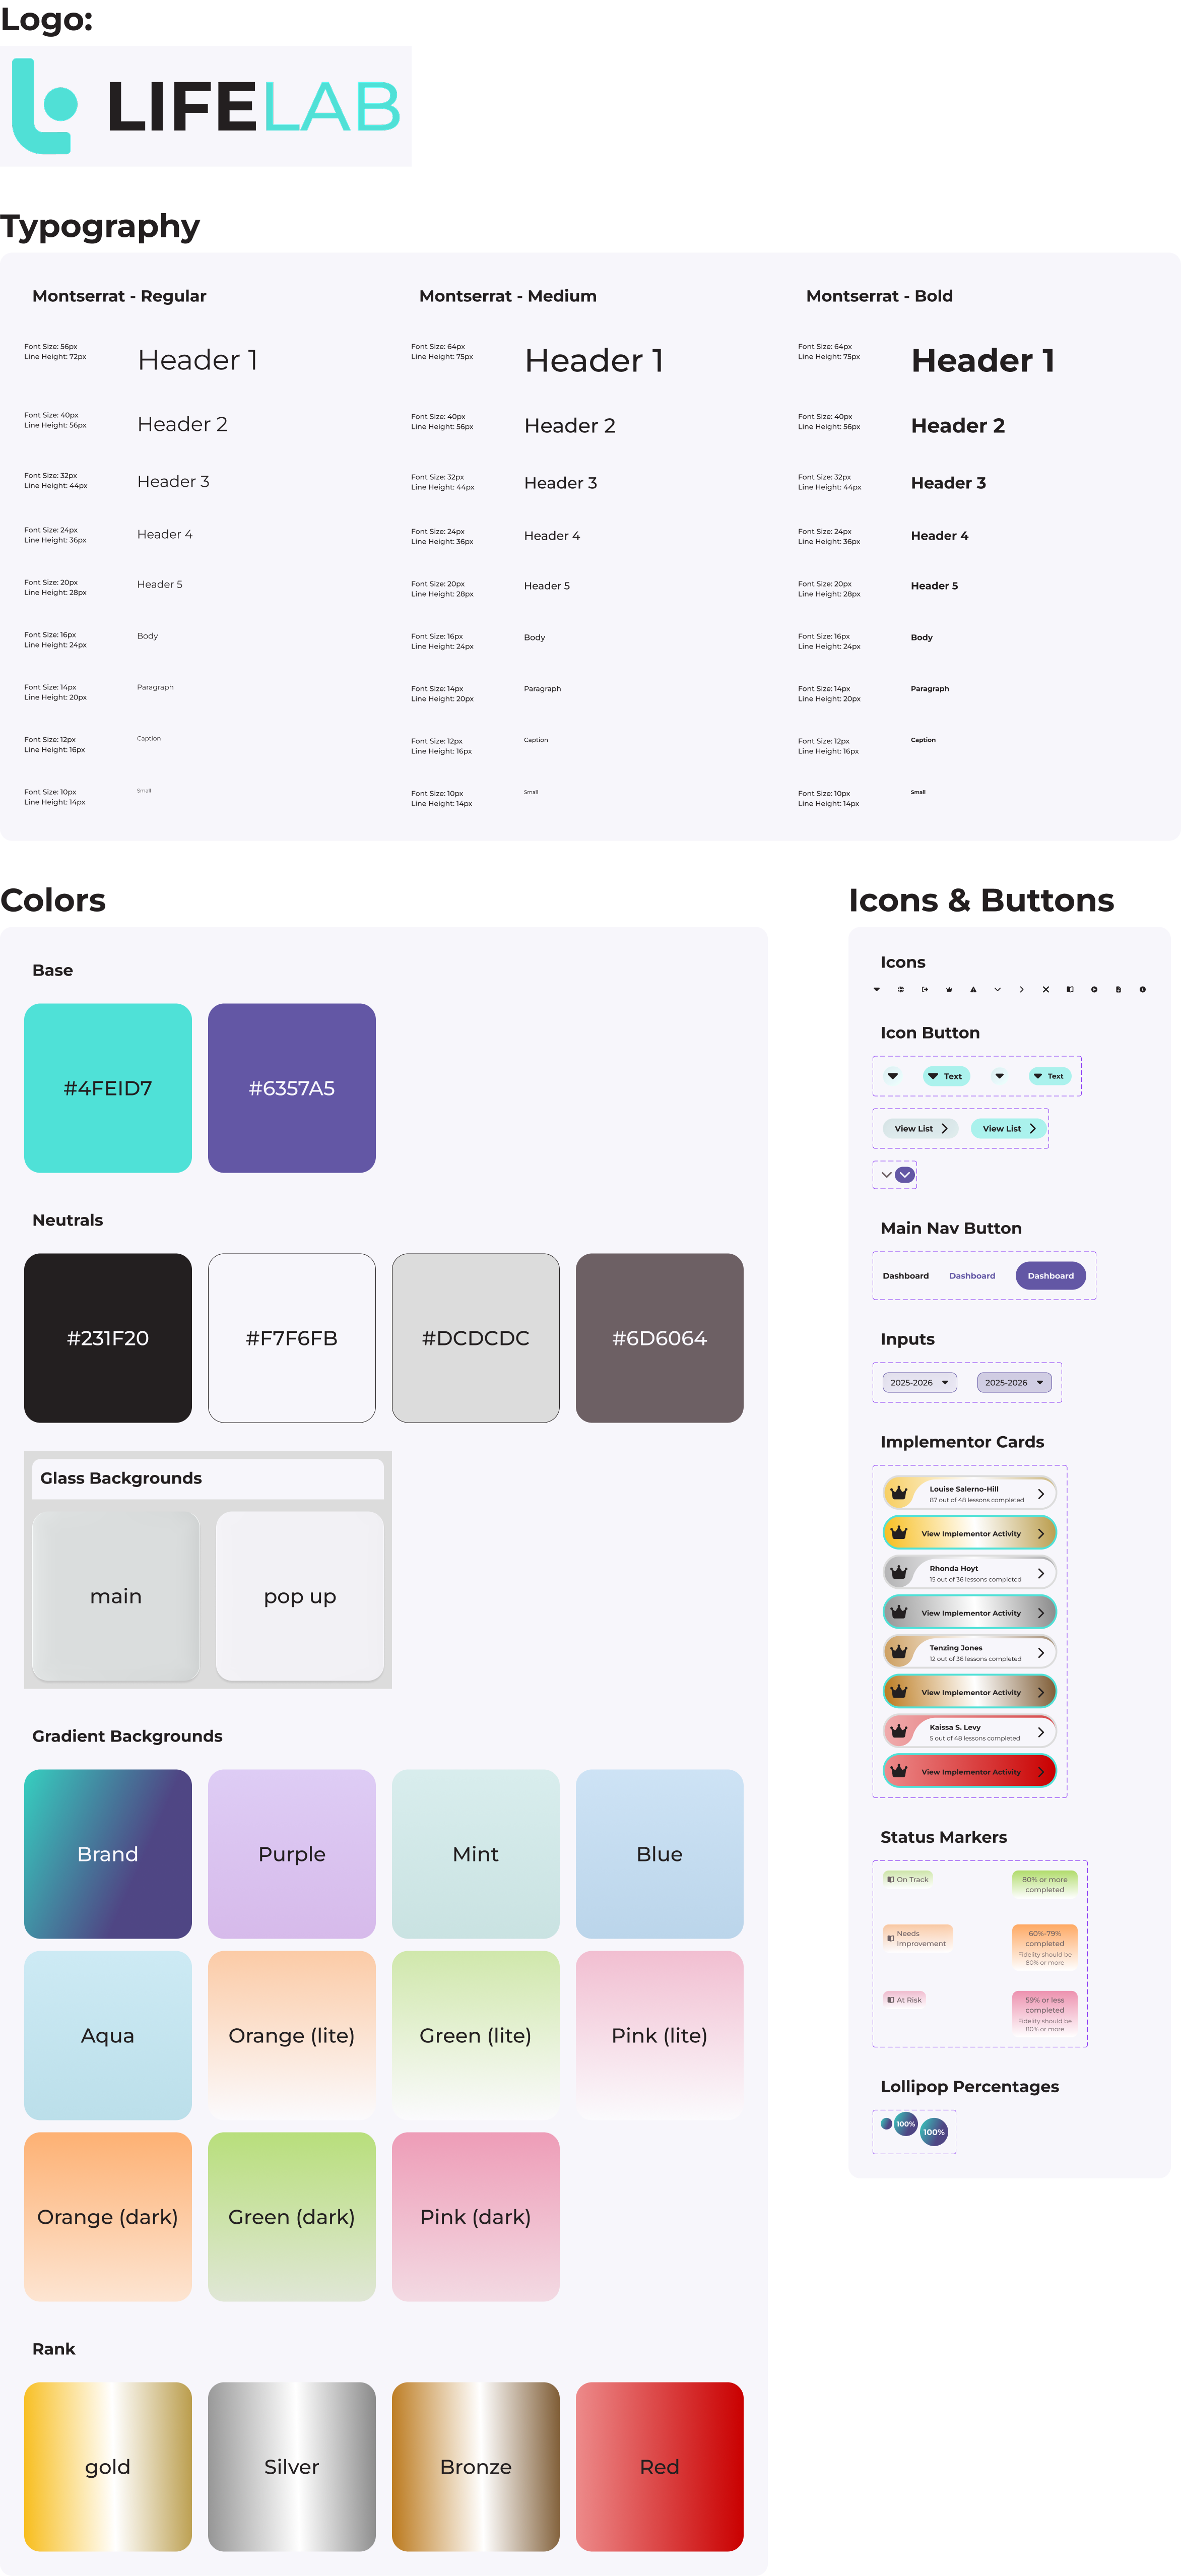
Creating a Design System with Branding and Accessibility in Mind
Colors and contrasts were selected with adherence to WCAG Level AAA standards— the highest of web accessibility. In the same vein, texts were all made to be readable with friendly sans-serif fonts.
Every now and then, I threw a little magic into the hover states, so users could find small delights as they explored the pages.
Walking Away with Newfound Knowledge
I have many takeaways from this project. However, one sticks out to me: nothing has to be boring.
In this case, the user wanted whimsy and color and fun. Who knew analyzing data could be all of those things?